This blog post will cover Skpr's solution for extracting specific details from your application to an AWS dashboard for graphing, consolidation, and analysis.
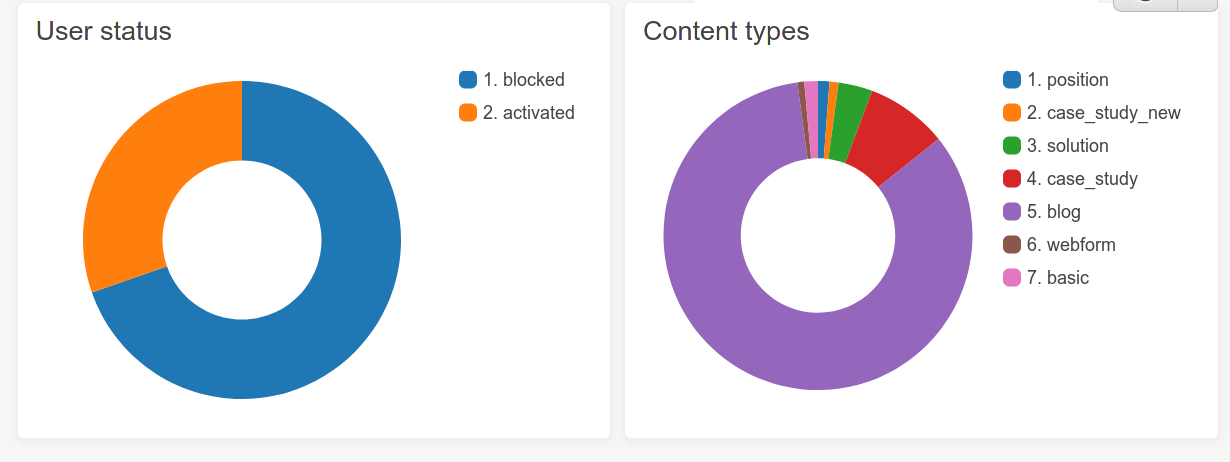
You might need access to up to date information about your application, how many webform submissions there are, you might want to know how many of your users are blocked, or how many users submitted a form with a specific response for one of the fields.
In any case, you'd need to go and find this information each time you want it, which can be quite a time consuming manual task. Or it could be deferred to a technical staff member, but if they were on leave or sick, would that mean this information is inaccessible?
Problem
There are several ways to extract information from Drupal websites. However, each approach introduces operational difficulties. For example, the need for dedicated staff with specific permissions or knowledge to retrieve this information and how up to date the data might be.
We want to bring information into CloudWatch Dashboards. To achieve this, we would need the information to be automated
and managed by the platform. So how do we solve this problem and bring this feature into Skpr?
Firstly, we need data to be available in a format that can be interpreted, so we chose the standard of OpenMetrics. If we had this information available, we'd want it to be centralised on the platform so that we wouldn't have to dedicate time to generate the data. This would solve the issue of having outdated information or point-in-time information instead of up to date and frequently updated information.
Planning our solution
Our idea is to have custom metrics supported by the platform to pull statistics directly from the execution of PHP inside Drupal. Webform metrics, email stats, module installation state, information on users - the data that could be exported is limited only by necessity and creativity.
From the application
Our first obstacle is getting our application to present the information in a standardised way for us to process it.
PreviousNext developed a solution for this some time ago - the Prometheus exporter.
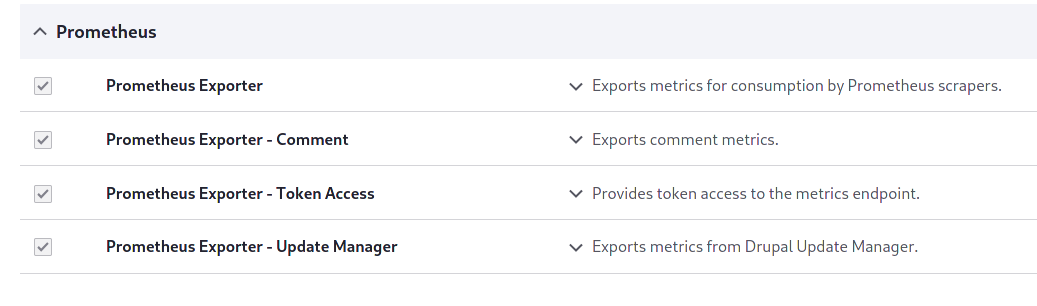
Prometheus Exporter is a Drupal module that enables an endpoint that external services or applications can scrape. It also allows the development of plugins to attach statistics to this endpoint. It comes with a range of plugins that can be used as an example to provide metrics at the endpoint.
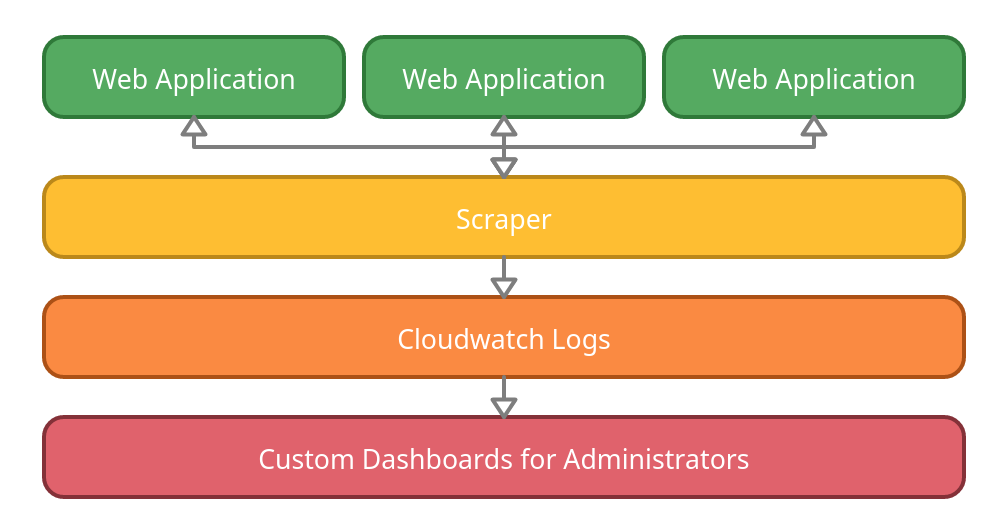
Scraping the data
Now that the information is exposed, we need to scrape the data into a centralised location. Skpr Ops staff have built a dedicated scraper for the platform. When enabled, it will sit inside your project and regularly split each metric by name from the aggregation into individual JSON items and send that information to the container logs for processing by the platform.
Starting to Scape Metrics
{"environment":"stg","metric":{"name":"drupal_user_count_total","type":"GAUGE","labels":{"status":"activated"},"value":"1"}}
{"environment":"stg","metric":{"name":"drupal_user_count_total","type":"GAUGE","labels":{"status":"blocked"},"value":"1"}}
{"environment":"stg","metric":{"name":"drupal_comment_count_total","type":"GAUGE","labels":{"status":"not published"},"value":"1"}}
{"environment":"stg","metric":{"name":"drupal_comment_count_total","type":"GAUGE","labels":{"status":"published"},"value":"1"}}
{"environment":"stg","metric":{"name":"drupal_node_count_total","type":"GAUGE","labels":{"bundle":"basic"},"value":"1"}}
{"environment":"stg","metric":{"name":"drupal_node_count_total","type":"GAUGE","labels":{"bundle":"blog"},"value":"1"}}
{"environment":"stg","metric":{"name":"drupal_node_count_total","type":"GAUGE","labels":{"bundle":"case_study"},"value":"1"}}
{"environment":"stg","metric":{"name":"drupal_node_count_total","type":"GAUGE","labels":{"bundle":"case_study_new"},"value":"1"}}
{"environment":"stg","metric":{"name":"drupal_node_count_total","type":"GAUGE","labels":{"bundle":"position"},"value":"1"}}
{"environment":"stg","metric":{"name":"drupal_node_count_total","type":"GAUGE","labels":{"bundle":"solution"},"value":"1"}}
{"environment":"stg","metric":{"name":"drupal_node_count_total","type":"GAUGE","labels":{"bundle":"webform"},"value":"1"}}
{"environment":"stg","metric":{"name":"drupal_phpinfo_version","type":"GAUGE","labels":{"major":"8","minor":"0","patch":"12","version":"8.x"},"value":"80000"}}
{"environment":"stg","metric":{"name":"drupal_queue_size_total","type":"GAUGE","labels":{"queue":"media_entity_thumbnail"},"value":"0"}}
{"environment":"stg","metric":{"name":"drupal_revision_count_total","type":"GAUGE","labels":{"bundle":"basic"},"value":"1"}}
{"environment":"stg","metric":{"name":"drupal_revision_count_total","type":"GAUGE","labels":{"bundle":"blog"},"value":"1"}}
{"environment":"stg","metric":{"name":"drupal_revision_count_total","type":"GAUGE","labels":{"bundle":"case_study"},"vale":"1"}}
{"environment":"stg","metric":{"name":"drupal_revision_count_total","type":"GAUGE","labels":{"bundle":"case_study_new"},"value":"1"}}
{"environment":"stg","metric":{"name":"drupal_revision_count_total","type":"GAUGE","labels":{"bundle":"position"},"value":"1"}}
{"environment":"stg","metric":{"name":"drupal_revision_count_total","type":"GAUGE","labels":{"bundle":"solution"},"value":"1"}}
{"environment":"stg","metric":{"name":"drupal_revision_count_total","type":"GAUGE","labels":{"bundle":"webform"},"value":"1"}}
{"environment":"stg","metric":{"name":"drupal_update_status_core_version","type":"GAUGE","labels":{"version":"9.x"},"value":"1"}}
{"environment":"stg","metric":{"name":"drupal_update_status_module_version","type":"GAUGE","labels":{"name":"config_filter","version":"8.x"},"value":"1"}}
{"environment":"stg","metric":{"name":"drupal_update_status_module_version","type":"GAUGE","labels":{"name":"config_ignore","version":"8.x"},"value":"1"}}
{"environment":"stg","metric":{"name":"drupal_update_status_module_version","type":"GAUGE","labels":{"name":"ctools","version":"8.x"},"value":"1"}}
{"environment":"stg","metric":{"name":"drupal_update_status_module_version","type":"GAUGE","labels":{"name":"diff","version":"8.x"},"value":"1"}}
{"environment":"stg","metric":{"name":"drupal_update_status_module_version","type":"GAUGE","labels":{"name":"ds","version":"8.x"},"value":"1"}}
Finished Scraping Metrics
Note: Data has been sanitised and is for demonstration purposes only
Building a dashboard
Developers can then build AWS CloudWatch dashboards around this information, where graphs can be mapped out by interpreting the JSON fields into content that can be filtered, searched, calculated or aggregated.
Monitoring custom metrics provided by Drupal will be a game-changer for platform managers, security and administrative staff. Direct and near-live metrics for managing Drupal sites with information sourced from anything that PHP can evaluate from within Drupal - is quite the exciting feature we hoped it would be.
 Note: Data has been sanitised and is for demonstration purposes only
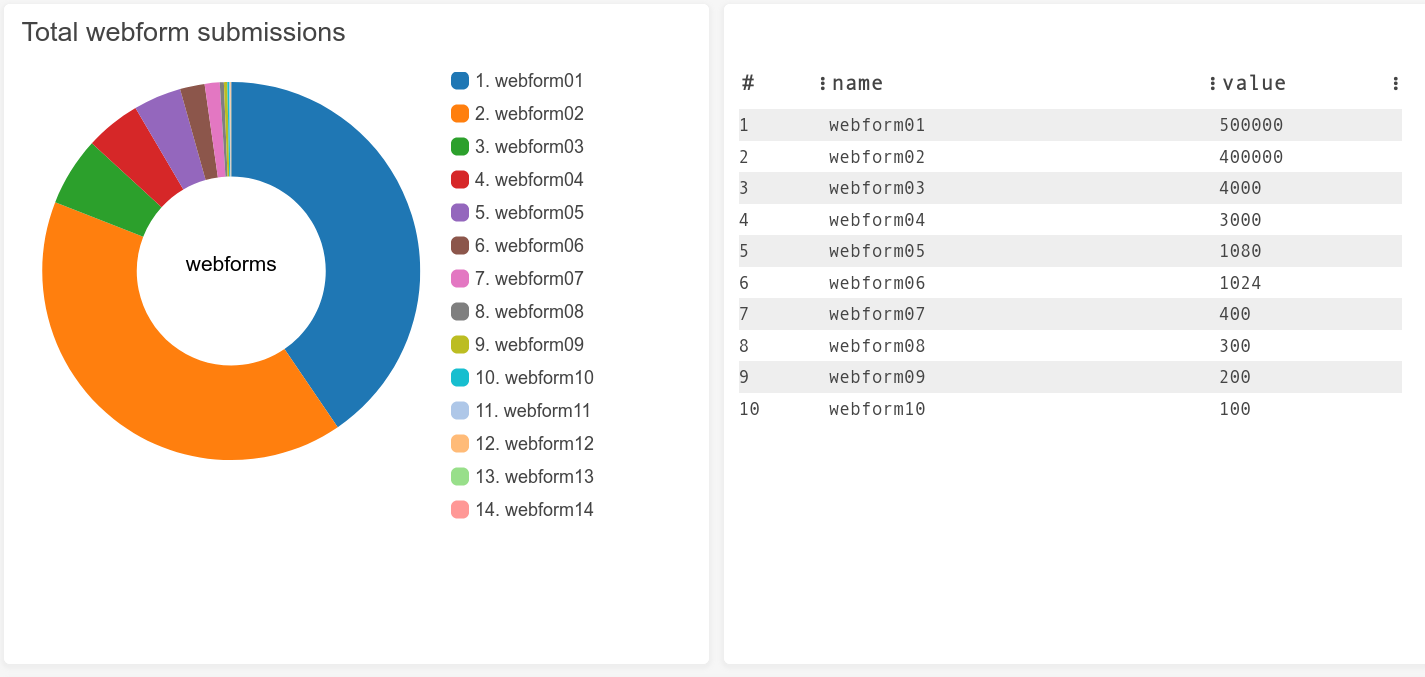
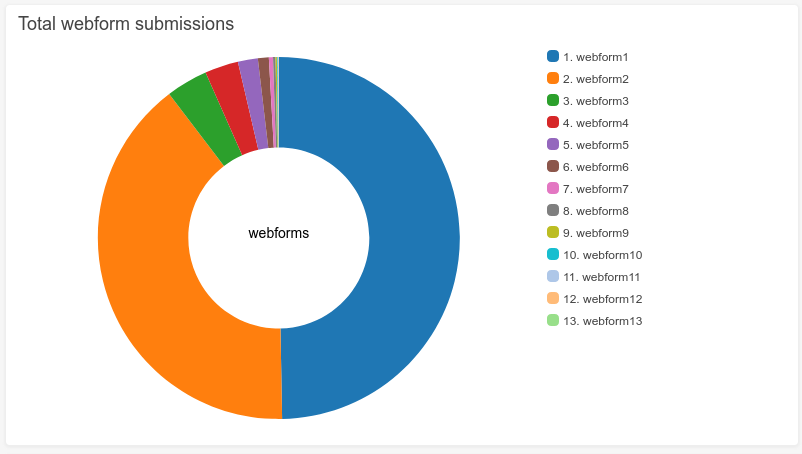
The above pie chart is a straightforward example of what this can do by showing the proportions of webforms on your Drupal website. It would indicate which is most popular overall, and this information comes from a row count in the webform tables. The user would still have access to tooltips which would show more details.
 Note: Data has been sanitised and is for demonstration purposes only
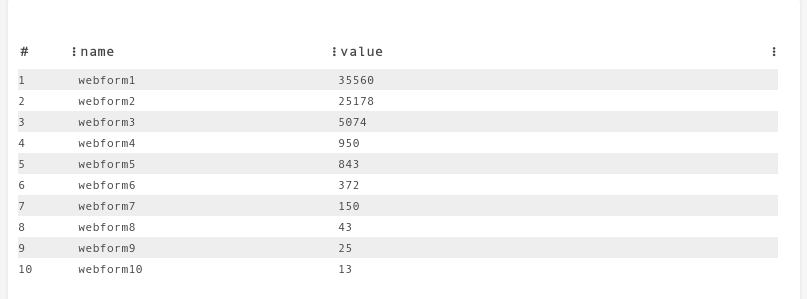
Another example would be showing the count for each web form as a table. Like the first example, it shows the machine name of each web form with a count of database rows for each webform presented as a table.
What comes next?
This is just the start. There's a lot of information that we're hoping to migrate into dashboards in the future. It's only limited to what you can extract from Drupal. We could track any value from Drupal directly in a range of widgets.